Auckland’s first urban heat assessment guides climate adaptation planning
Auckland Urban Heat Assessment

Rising temperatures and extreme heat are growing concerns for Auckland’s liveability. To better plan for future summers and build resilience, Auckland Council sought data on which parts of the city experience the urban heat island effect – a phenomenon where urban areas experience higher temperatures than rural surroundings. The Council also aims to inform and empower communities with practical steps to reduce heat in their neighbourhoods.
We collaborated with Auckland Council to better understand the temperature patterns across Auckland and their underlying drivers. Using a creative modelling approach combining advanced climate modelling tools, Weather Research and Forecasting (WRF) and our proprietary digital tool, UHeat, we analysed air temperature trends over 5,000 square kilometres over five months. We captured key insights in a geospatial data set, technical report and community summary document.
Auckland Council now has valuable data and insights to inform climate adaptation planning and minimise the effects of extreme heat on communities. These insights are accessible to everyone via Auckland Council’s website which include considerations for mitigating the effects of urban heat, including community cooling and respite areas, green and blue infrastructure, and permeable and cool surfaces. Our experience and creative modelling approach is supporting other cities respond to urban heat challenges.
A novel approach to urban heat assessment
Already a data-rich organisation, Auckland Council sought an evidence-based approach to identifying the urban heat island effect to inform climate adaptation planning. Auckland’s unique geography – a narrow strip of land bordered by oceans – makes wind a major factor in urban heat patterns.

In a first for Auckland and our firm, we developed a tailored urban heat assessment method incorporating wind’s impact on the urban heat island effect, using the Weather Research and Forecasting (WRF) model to analyse the impact of large-scale wind patterns, combined with UHeat to simulate urban heat mechanisms. The analysis used local high-resolution datasets on landcover as well as data on building heights and population density. We evaluated a five-month period, from November 2021 to March 2022, producing a dataset with air temperature predictions at two metres above ground level at a high resolution of 300 x 300m across 5,000 square kilometres. An Academic expert, Dr Ting-Sun from University College London, peer reviewed our findings, adding further insight.
Key insights revealed Auckland’s city centre experiences an urban heat island effect, with nighttime temperatures up to 3°C higher than rural areas. A 2°C temperature variation also appeared within the city centre during peak temperature days, highlighting the influence of localised factors.
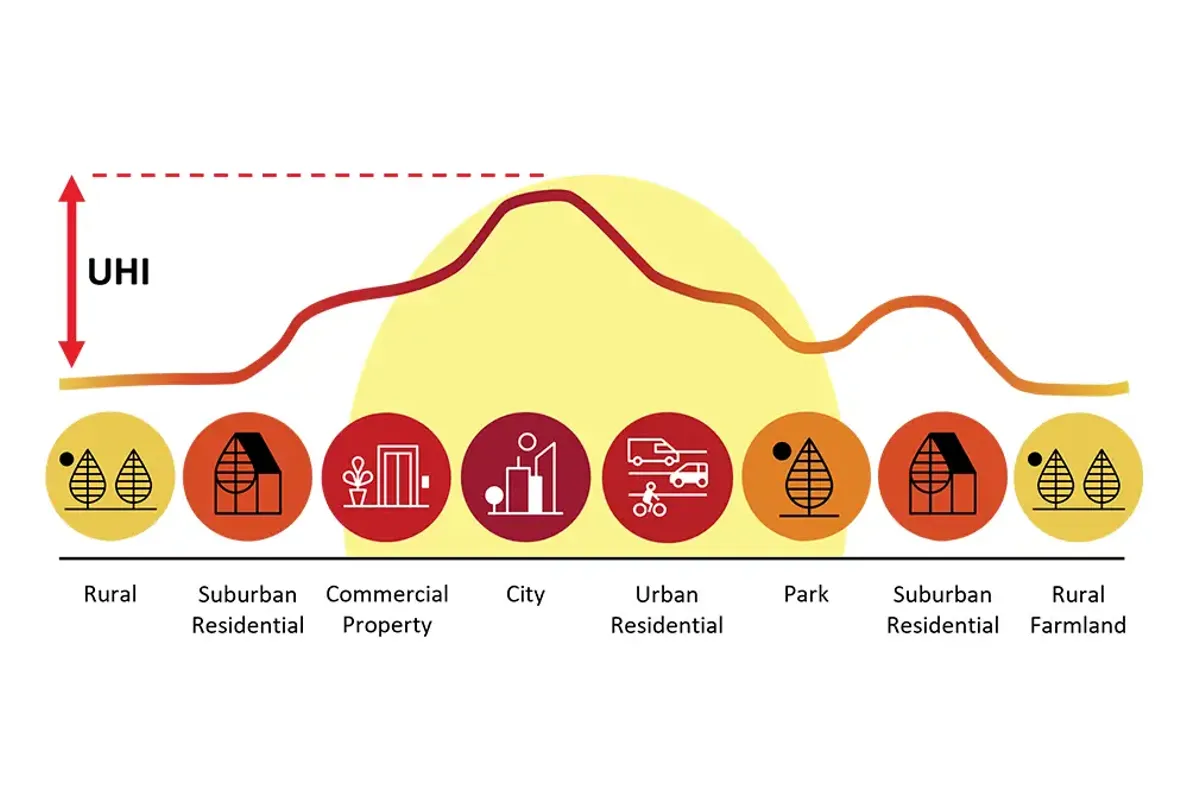
The urban heat island (UHI) effect – a phenomenon where urban areas experience higher temperatures than rural surroundings
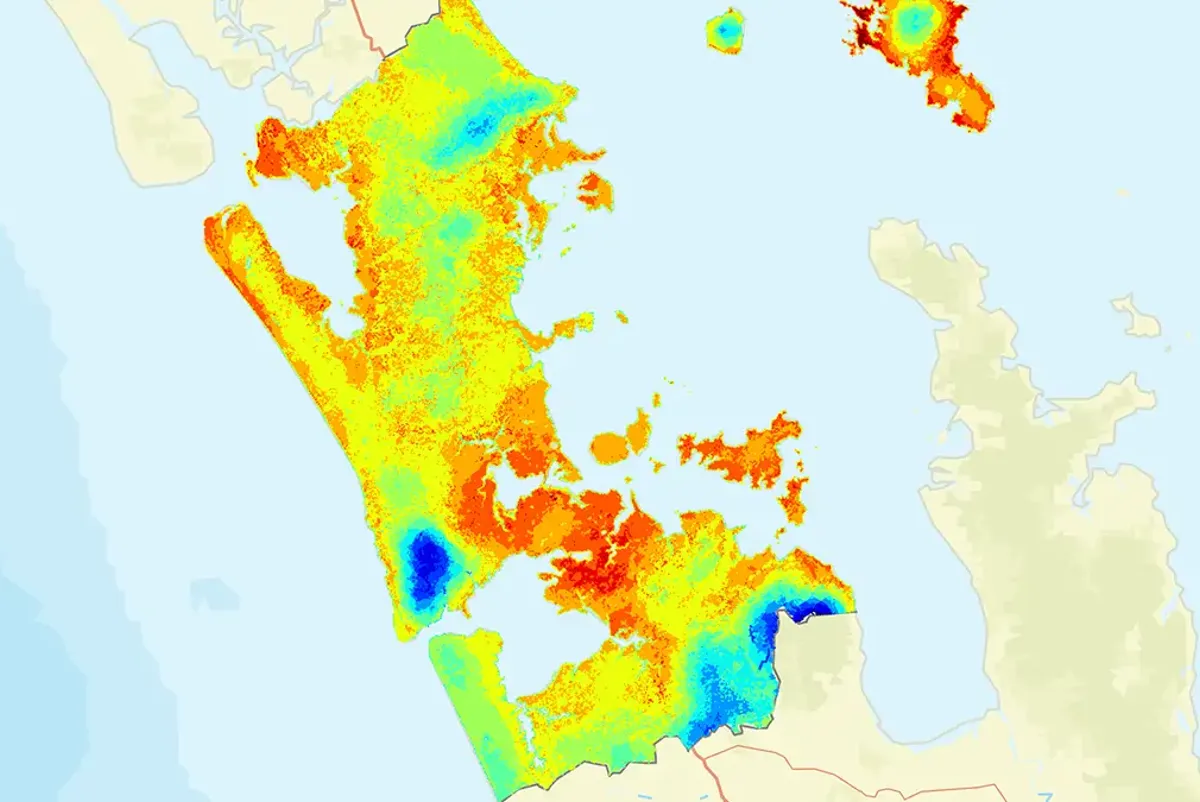
Heat map of the Auckland region showing analysis of air temperature trends over 5,000 square kilometres over five months*
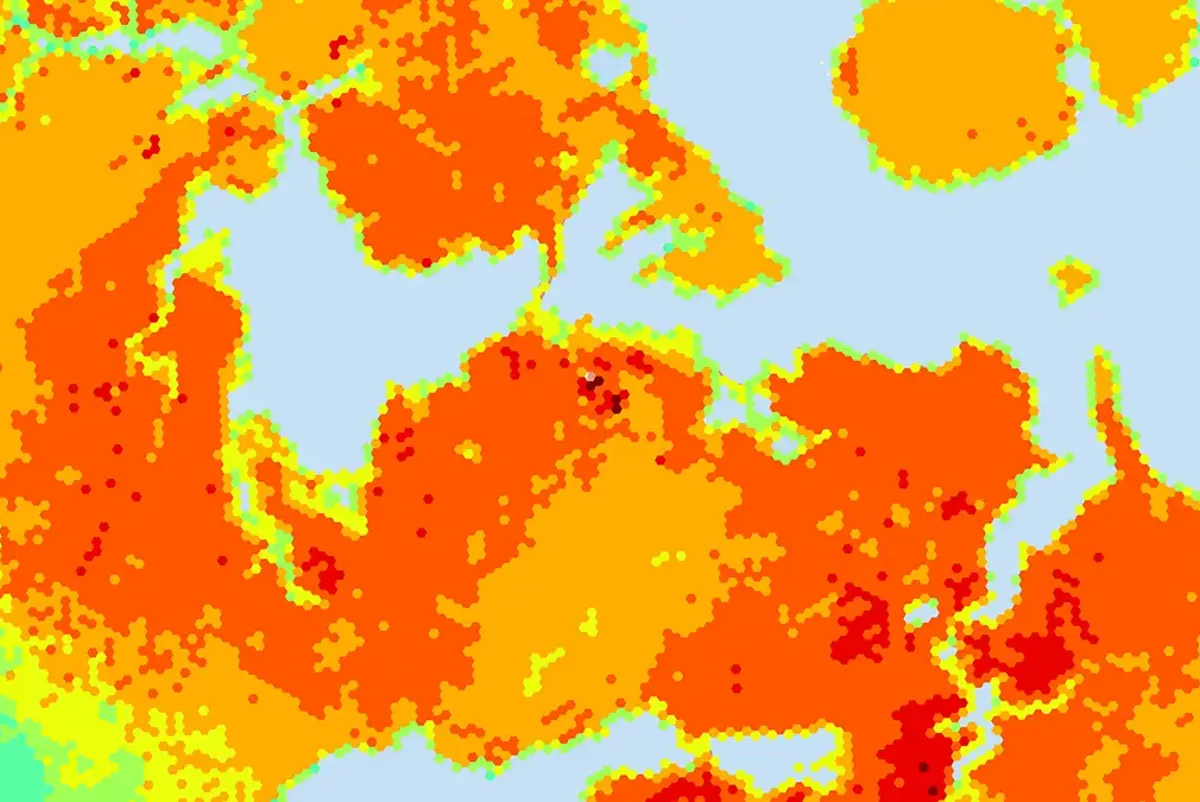
Heat map of urban Auckland showing average air temperature over a five-month period*
Providing practical climate adaptation advice to communities
Throughout the project, Auckland Council was driven by a community-focused goal to communicate the risks of rising temperatures and extreme heat to Aucklanders while using the dataset to inform adaptation programmes to improve climate resilience.
We developed technical and non-technical information outputs so all Aucklanders could easily access and understand vital information about rising temperatures and extreme heat. This information is available to the public through the council’s research hub, Knowledge Auckland. Our research also includes global examples of both short and long-term heat mitigation actions, including maps of cooler areas, water points, cooling centres, nature-based solutions, such as expanding tree canopy cover, and building retrofit measures including shading, natural ventilation, and cool surfaces to reduce urban heat. Auckland Council now has a comprehensive dataset to inform and support communication on heat-related hazards and engagement with communities on heat mitigation strategies.
*Further information on data sources relating to the heat maps above; heat map of urban Auckland: data from Stats NZ, Esri, TomTom, Garmin, Foursquare, METI/NASA, USGS, Lynker Analytics, Auckland Council: Healthy Waters, Geospatial, Contains modified Copernicus Climate Change Service information 2024 / heat map of Auckland region: data from Stats NZ, Esri, TomTom, Garmin, FAO, NOAA, USGS, Lynker Analytics, Auckland Council: Healthy Waters, Geospatial, Contains modified Copernicus Climate Change Service information 2024.
Projects
Explore more climate & sustainability projects

Helping London Gatwick assess carbon emissions to drive sustainable aviation
Carbon emissions study for London Gatwick, United Kingdom

Promoting climate resilient flood defence and development through nature-based solutions
Lower Darent Riverside Strategy, United Kingdom

Wetland habitat restoration at a landscape scale
Great North Fen – Restoring the Durham Carrs, United Kingdom

Supporting Network Rail’s transformation to meet the challenges of climate change
Weather resilience and drainage asset management transformation, United Kingdom
Get in touch with us
If you'd like to speak to one of our digital experts about any of the issues raised on this page or a potential collaboration then please get in touch by completing the form.
